Tutorial
The SED is consists of a basic menu containing three entrances: File, Analysis and Help.
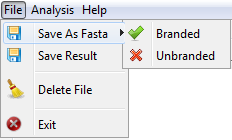
In the File option, the user can to save a file in FASTA format containing the genetic sequences, choosing two options to save the data (marked sequences and sequences no marked). The user can also save the results of the statistical calculations of the analysis in text format, delete all the files included in the interface and end the program.
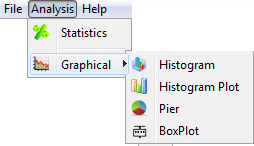
On the Analysis option, you can generate statistical calculations and graphs of the data analyzed, with the graphics options Histogram, Histogram with Error, Pizza and BoxPlot.
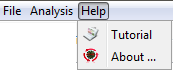
And the Help option will have a statement to manipulation software.
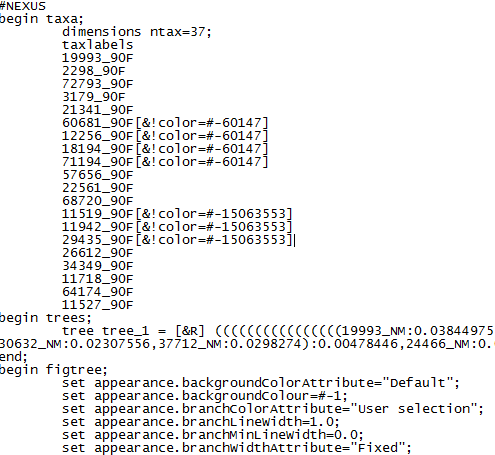
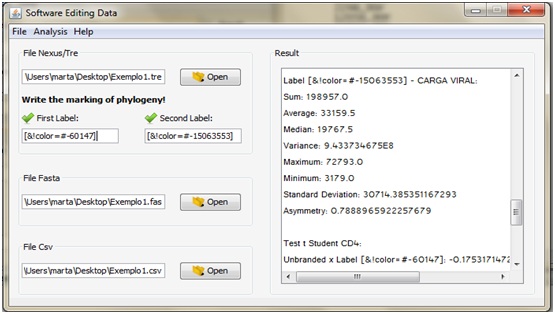
The system execution starts with the Annex to NEXUS file with the edits made in the analysis of the phylogenetic tree, and then, enter the code markings assigned when creating the NEXUS file. Then the user must select the FASTA file containing the genetic sequences of patients for analysis, therefore, we must choose the File >> Save Fasta option to generate a new FASTA file. To generate descriptive statistics and the test t student, the user must enter the worksheet in CSV format containing the clinical data of individuals, however, it is important to identify each patient is in the first column of the spreadsheet. After the procedure, you must choose the menu, the analysis option >> Statistics, and so the result will be shown in the Results area, and subsequently might save it in text file in the File tab >> Save Result. If you prefer to show the graphic, the user simply choose the analysis >> Graph option, and so, you can select up to four graphic options.